Abstract
Lysosomes are multifunctional, subcellular organelles with roles in plasma membrane repair, autophagy, pathogen degradation and nutrient sensing. Dysfunctional lysosomes underlie Alzheimer’s disease, Parkinson’s disease and rare lysosomal storage diseases, but their contributions to these pathophysiologies are unclear. Live imaging has revealed lysosome subpopulations with different physical characteristics including dynamics, morphology or cellular localization. Here, we chemically resolve lysosome subpopulations using a DNA-based combination reporter that quantitatively images pH and chloride simultaneously in the same lysosome while retaining single-lysosome information in live cells. We call this technology two-ion measurement or 2-IM. 2-IM of lysosomes in primary skin fibroblasts derived from healthy individuals shows two main lysosome populations, one of which is absent in primary cells derived from patients with Niemann–Pick disease. When patient cells are treated with relevant therapeutics, the second population re-emerges. Chemically resolving lysosomes by 2-IM could enable decoding the mechanistic underpinnings of lysosomal diseases, monitoring disease progression or evaluating therapeutic efficacy.
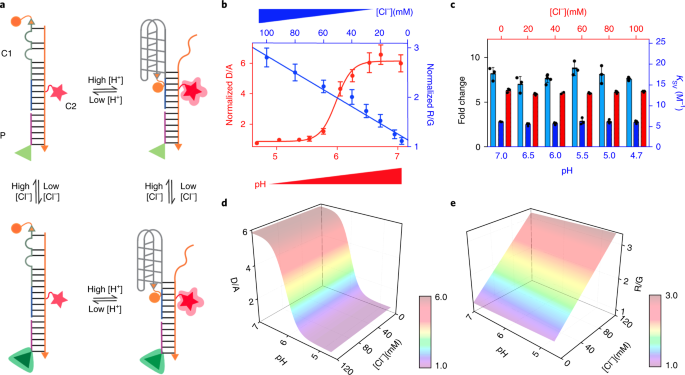
a, Schematic of the working principle. A pH-induced change in fluorescence resonance energy transfer between Alexa 546 (donor, orange sphere) and Alexa 647 (acceptor, red star) reports pH ratiometrically. A Cl−-sensitive fluorophore (BAC, green triangle) and Alexa 647 reports Cl− ratiometrically. P, Cl−-sensing module (purple line) containing a Cl−-sensitive fluorophore BAC; C1, pH-sensing module containing i-motif sequence (grey line); C2, normalizing module (orange line) containing a pH, Cl−-insensitive fluorophore Alexa 647. b, pH and Cl− response profiles of ChloropHore. Normalized fluorescence intensity ratio (D/A) of donor (D) and acceptor (A) on donor excitation in vitro as a function of pH and 50 mM Cl−(red). Normalized fluorescence intensity ratio (R/G) of Alexa 647 (R) and BAC (G) as a function of Cl− concentration at pH 7 (blue). Values were normalized to R/G at 5 mM Cl− or D/A at pH 4. c, Performance of the pH-sensing module (red) at different [Cl−] and of the Cl−-sensing module at different pH values (blue). Fold changes in D/A (red bars) or R/G (dark blue bars) for the pH- and Cl−-sensing modules are shown. Stern–Volmer constant (KSV, light blue bars) for Cl− sensing at each pH is also shown. d,e, Calibration surface plots of D/A (d) and R/G (e) of ChloropHore as a function of Cl− and pH. Error bars indicate the mean ± standard error of the mean (s.e.m.) of three independent measurements.
원문: 여기를 클릭하세요~
